Skala
“Dulu data, analisis, sama skrip R kita kececer di mana-mana. Sekarang semua masuk Blade, jadi satu tim tinggal buka dan cek hasilnya bareng. Simpel banget sih.”

Febrilian
CEO, Skala
Blade mengerjakan bagian terberatnya, jadi Anda bisa fokus menemukan insight yang penting.
Unduh Blade macOS dan Windows, betaBuka folder, lalu bertanya dengan bahasa sehari-hari. Blade menjalankan R di komputer Anda, jadi tabel, grafik, dan skripnya cepat didapat.
 Study A › CHD risk factors
| age | sysBP | BMI | TenYearCHD |
|---|---|---|---|
| 39 | 106 | 26.97 | 0 |
| 46 | 121 | 28.73 | 0 |
| 48 | 127.5 | 25.34 | 0 |
| 61 | 150 | 28.58 | 1 |
| 46 | 130 | 23.1 | 0 |
| 43 | 180 | 30.3 | 0 |
Which risk factors relate most to ten-year CHD?
Age and systolic BP are the strongest, then hypertension and diastolic BP.
| with TenYearCHD | r | 95% CI | p |
|---|---|---|---|
| age | 0.23 | 0.20 to 0.25 | < .001 |
| sysBP | 0.22 | 0.19 to 0.24 | < .001 |
| prevalentHyp | 0.18 | 0.15 to 0.21 | < .001 |
| diaBP | 0.15 | 0.12 to 0.17 | < .001 |
Study A › CHD risk factorsDone. Five figures from the Framingham data are in Study A.
R_fig4_age_sex.pngPNG · 76 KB
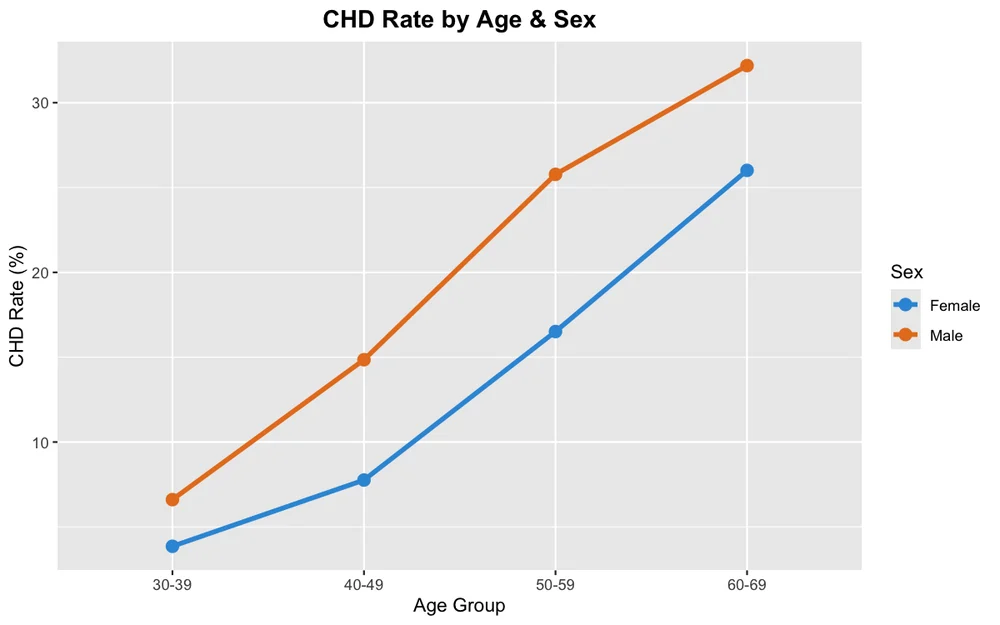
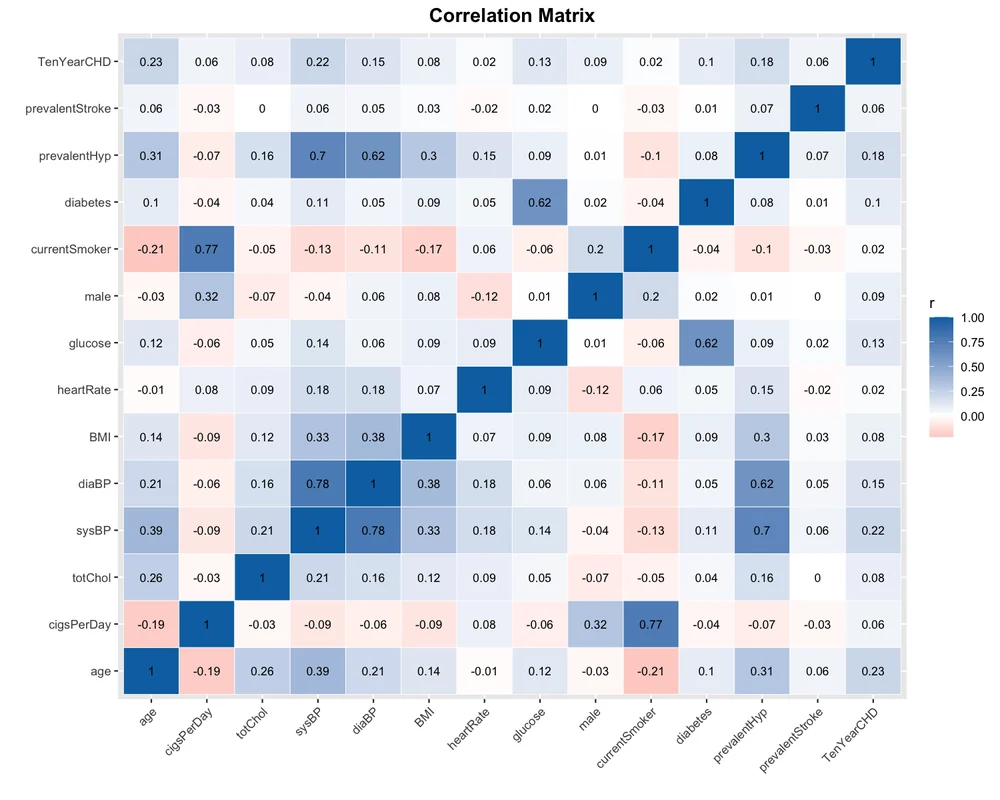
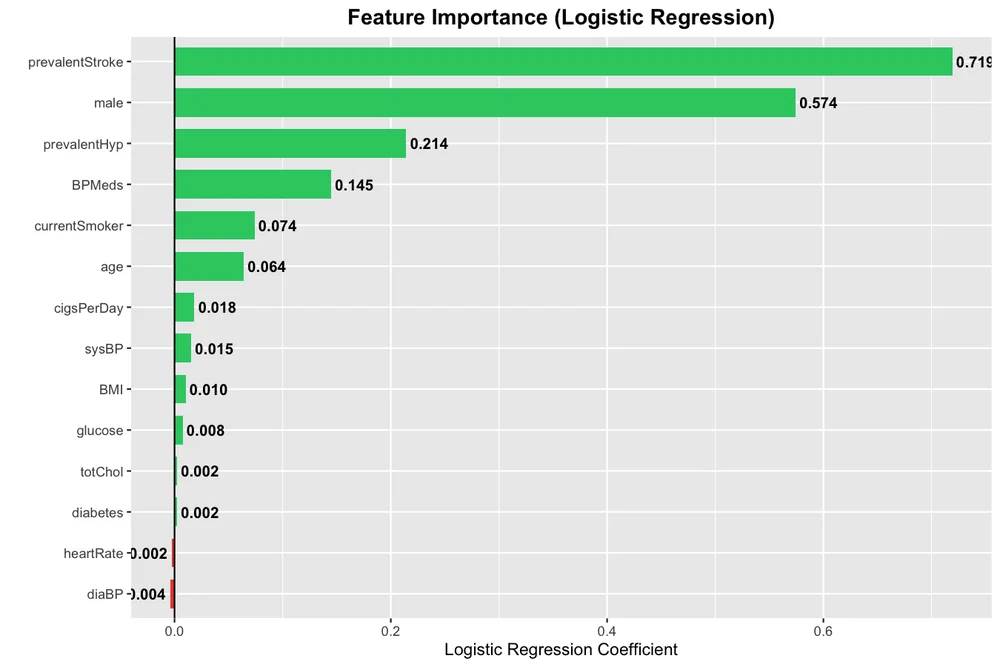
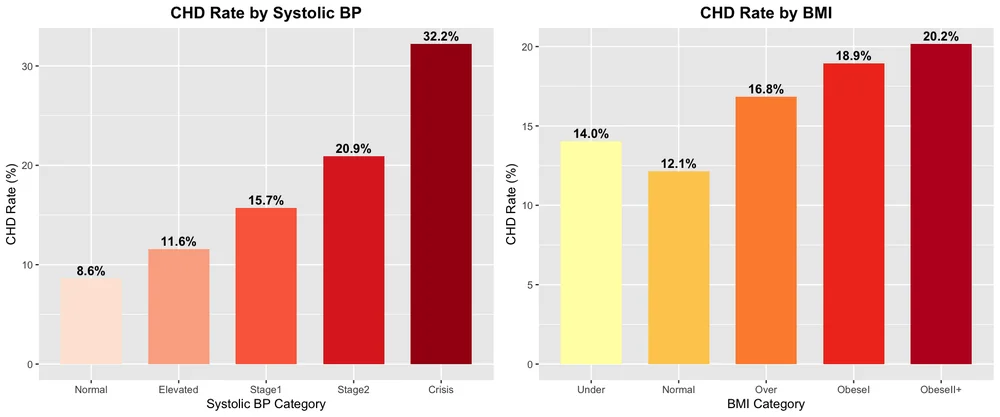
 Study A › CHD risk factors
1# Framingham -- linear regression output (OLS)2df <- read.csv("framingham.csv", check.names = FALSE)3 4# 2. multiple: sysBP5m2 <- lm(sysBP ~ age + male + BMI + heartRate + totChol,6 data = df)7print(summary(m2))Console
Call:lm(formula = sysBP ~ age + male + BMI + heartRate + totChol, data = df) Residuals: Min 1Q Median 3Q Max -64.300 -12.481 -2.465 9.921 125.865 Coefficients: Estimate Std. Error t value Pr(>|t|) (Intercept) 22.531293 3.091221 7.289 3.72e-13 ***age 0.864168 0.035665 24.230 < 2e-16 ***male -1.128182 0.596856 -1.890 0.0588 . BMI 1.425642 0.072987 19.533 < 2e-16 ***heartRate 0.290839 0.024571 11.837 < 2e-16 ***totChol 0.036349 0.006852 5.305 1.19e-07 ***---Signif. codes: 0 ‘***’ 0.001 ‘**’ 0.01 ‘*’ 0.05 ‘.’ 0.1 ‘ ’ 1 Residual standard error: 18.84 on 4165 degrees of freedom (69 observations deleted due to missingness)Multiple R-squared: 0.2642, Adjusted R-squared: 0.2633 F-statistic: 299.1 on 5 and 4165 DF, p-value: < 2.2e-16
| male | age | education | currentSmoker | cigsPerDay | BPMeds | prevalentStroke | prevalentHyp | diabetes | totChol | sysBP | diaBP | BMI | heartRate | glucose | TenYearCHD | |
|---|---|---|---|---|---|---|---|---|---|---|---|---|---|---|---|---|
| 1 | 1 | 39 | 4 | 0 | 0 | 0 | 0 | 0 | 0 | 195 | 106 | 70 | 26.97 | 80 | 77 | 0 |
| 2 | 0 | 46 | 2 | 0 | 0 | 0 | 0 | 0 | 0 | 250 | 121 | 81 | 28.73 | 95 | 76 | 0 |
| 3 | 1 | 48 | 1 | 1 | 20 | 0 | 0 | 0 | 0 | 245 | 127.5 | 80 | 25.34 | 75 | 70 | 0 |
| 4 | 0 | 61 | 3 | 1 | 30 | 0 | 0 | 1 | 0 | 225 | 150 | 95 | 28.58 | 65 | 103 | 1 |
| 5 | 0 | 46 | 3 | 1 | 23 | 0 | 0 | 0 | 0 | 285 | 130 | 84 | 23.1 | 85 | 85 | 0 |
| 6 | 0 | 43 | 2 | 0 | 0 | 0 | 0 | 1 | 0 | 228 | 180 | 110 | 30.3 | 77 | 99 | 0 |
| 7 | 0 | 63 | 1 | 0 | 0 | 0 | 0 | 0 | 0 | 205 | 138 | 71 | 33.11 | 60 | 85 | 1 |
| 8 | 0 | 45 | 2 | 1 | 20 | 0 | 0 | 0 | 0 | 313 | 100 | 71 | 21.68 | 79 | 78 | 0 |
| 9 | 1 | 52 | 1 | 0 | 0 | 0 | 0 | 1 | 0 | 260 | 141.5 | 89 | 26.36 | 76 | 79 | 0 |
| 10 | 1 | 43 | 1 | 1 | 30 | 0 | 0 | 1 | 0 | 225 | 162 | 107 | 23.61 | 93 | 88 | 0 |
| 11 | 0 | 50 | 1 | 0 | 0 | 0 | 0 | 0 | 0 | 254 | 133 | 76 | 22.91 | 75 | 76 | 0 |
| 12 | 0 | 43 | 2 | 0 | 0 | 0 | 0 | 0 | 0 | 247 | 131 | 88 | 27.64 | 72 | 61 | 0 |
| 13 | 1 | 46 | 1 | 1 | 15 | 0 | 0 | 1 | 0 | 294 | 142 | 94 | 26.31 | 98 | 64 | 0 |
| 14 | 0 | 41 | 3 | 0 | 0 | 1 | 0 | 1 | 0 | 332 | 124 | 88 | 31.31 | 65 | 84 | 0 |
| 15 | 0 | 39 | 2 | 1 | 9 | 0 | 0 | 0 | 0 | 226 | 114 | 64 | 22.35 | 85 | NA | 0 |
| 16 | 0 | 38 | 2 | 1 | 20 | 0 | 0 | 1 | 0 | 221 | 140 | 90 | 21.35 | 95 | 70 | 1 |
| 17 | 1 | 48 | 3 | 1 | 10 | 0 | 0 | 1 | 0 | 232 | 138 | 90 | 22.37 | 64 | 72 | 0 |
| 18 | 0 | 46 | 2 | 1 | 20 | 0 | 0 | 0 | 0 | 291 | 112 | 78 | 23.38 | 80 | 89 | 1 |
| 19 | 0 | 38 | 2 | 1 | 5 | 0 | 0 | 0 | 0 | 195 | 122 | 84.5 | 23.24 | 75 | 78 | 0 |
| 20 | 1 | 41 | 2 | 0 | 0 | 0 | 0 | 0 | 0 | 195 | 139 | 88 | 26.88 | 85 | 65 | 0 |
==============================================================================
0. SAMPLE
==============================================================================
Rows: 4240   Columns: 16

==============================================================================
1. SIMPLE LINEAR REGRESSION: systolic BP ~ age
==============================================================================

Call:
lm(formula = sysBP ~ age, data = df)

Residuals:
    Min      1Q  Median      3Q     Max
-57.382 -13.627  -2.627  10.182 148.042

Coefficients:
            Estimate Std. Error t value Pr(>|t|)
(Intercept) 82.14199    1.82570   44.99   <2e-16 ***
age          1.01276    0.03628   27.91   <2e-16 ***
---
Signif. codes:  0 ‘***’ 0.001 ‘**’ 0.01 ‘*’ 0.05 ‘.’ 0.1 ‘ ’ 1

Residual standard error: 20.25 on 4238 degrees of freedom
Multiple R-squared:  0.1553,	Adjusted R-squared:  0.1551
F-statistic:   779 on 1 and 4238 DF,  p-value: < 2.2e-16


Equation: sysBP = 82.142 + 1.0128 * age
n = 4240, R2 = 0.1553, adj R2 = 0.1551, residual SE = 20.253 mmHg
95% CI for slope: [0.9416, 1.0839]

==============================================================================
2. MULTIPLE LINEAR REGRESSION: sysBP ~ age + male + BMI + heartRate + totChol
==============================================================================

Call:
lm(formula = sysBP ~ age + male + BMI + heartRate + totChol,
    data = df)

Residuals:
    Min      1Q  Median      3Q     Max
-64.300 -12.481  -2.465   9.921 125.865

Coefficients:
             Estimate Std. Error t value Pr(>|t|)
(Intercept) 22.531293   3.091221   7.289 3.72e-13 ***
age          0.864168   0.035665  24.230  < 2e-16 ***
male        -1.128182   0.596856  -1.890   0.0588 .
BMI          1.425642   0.072987  19.533  < 2e-16 ***
heartRate    0.290839   0.024571  11.837  < 2e-16 ***
totChol      0.036349   0.006852   5.305 1.19e-07 ***
---
Signif. codes:  0 ‘***’ 0.001 ‘**’ 0.01 ‘*’ 0.05 ‘.’ 0.1 ‘ ’ 1

Residual standard error: 18.84 on 4165 degrees of freedom
  (69 observations deleted due to missingness)
Multiple R-squared:  0.2642,	Adjusted R-squared:  0.2633
F-statistic: 299.1 on 5 and 4165 DF,  p-value: < 2.2e-16


n = 4171, R2 = 0.2642, adj R2 = 0.2633, F = 299.07, residual SE = 18.840
Buka file CSV, Excel, atau SPSS, lalu jelaskan apa yang ingin Anda ketahui.
Lihat tabel, grafik, dan pemeriksaan asumsi di satu tempat.
Periksa kodenya, jalankan kembali, atau bagikan dengan rekan.
Simpan data, percakapan, dan skrip R bersama. Pindah proyek tanpa kehilangan progres.
Study A 4 files
Mengumpulkan data butuh berbulan-bulan. Analisisnya tidak perlu selama itu.
Di mana 588 studi klinis tersendat:
44,3%
Rekrutmen pasien26,7%
Pengumpulan data21,5%
Analisis dan interpretasi data20,4%
Desain studi20,2%
PublikasiUntuk keputusan bisnis dan riset yang membutuhkan jawaban jelas.
Skala
“Dulu data, analisis, sama skrip R kita kececer di mana-mana. Sekarang semua masuk Blade, jadi satu tim tinggal buka dan cek hasilnya bareng. Simpel banget sih.”
CEO, Skala
Risetku
“Jujur paling males kalau mau lanjutin riset terus harus nyari data sama catatan satu-satu. Di Blade udah ngumpul semua, tinggal gas lanjut.”

CEO, Risetku
Rp0
Lihat apa yang dikerjakan Blade dengan dataset Anda sendiri.
Tersedia untuk macOS dan Windows.
Rp299.000 untuk satu bulan
Untuk tenggat dan bulan riset yang padat.
Bayar dengan QRIS atau virtual account bank.